
Instrumentation
We built the system.
Most coatings tests that matter — washability, dirt pickup, surface disfigurement — have always come down to someone rating a panel by eye. We built a panel imaging system that measures them instead.
01 — The instrument
A measurement, not a photograph
A photograph of a panel records the lighting as much as the coating. The middle reads brighter than the edges, the geometry moves with every setup, and two shots of the same panel are never quite the same measurement.
Ours is built the other way round. Every part of the panel is presented under identical conditions, so there is no falloff toward the edges, no hot spot in the middle, and none of the geometry that makes an image unusable as a measurement. A panel read today and the same panel read a year from now are directly comparable.
What comes out is not a picture. It is a record of the panel's surface, holding far finer differences in colour than an ordinary image can carry, and those differences are what these tests turn on. How we get there is the part we keep.
02 — Against a spectrophotometer
The whole panel is the measurement
A spectrophotometer
Reads a small aperture at a time. You take a handful of spots, average them, and hope they represent the panel. Anything uneven — a gradient, a streak, an edge effect, a patch of mildew — is either missed entirely or averaged away.
Our system
Reads every pixel, with colour data comparable to a non-sphere spectrophotometer. Nothing is sampled and nothing is averaged away — the distribution across the surface is part of the result, which is exactly what these tests are about.
The aperture becomes a choice
Because every pixel is kept, the aperture stops being something you commit to before the test and becomes something you place after it. Any size, anywhere on the panel, as many at once as you like.
It can be a synthetic aperture: one sized to match the instrument a client already runs, so the numbers land in a form their own lab recognises. Or a hundred of them across a single face, which is not a thing anyone was going to do by hand. And a panel that has already been measured can be read again at a different spot without going near the panel a second time.
It is also how we check ourselves. One of those regions is placed where the test should have changed nothing at all, and it is read on every panel in the study, every time. If it has moved, we know before we look at a single result.
03 — Non-uniform surfaces
Where a spectrophotometer cannot follow
A spectrophotometer assumes the surface inside its aperture is uniform. On a drawdown that is fair enough. On a real substrate it stops being true.
Take a stained wood panel. The grain, the knots and the pale and dark bands running through the wood move the colour around by more than the effect you are trying to measure. Land the aperture on clear grain and you get one answer; land it on a knot and you get another. Both are correct readings of the spot they landed on. What you do not have is a reading of the board. Taking more spots will not fix it, because the spread is not noise in the measurement. It is the wood itself.
So we do not try to measure the surface once. We scan the whole panel before the test and again after, and take the difference. The grain and the knots were there in both scans, so they sit in both averages and fall out of the comparison. What is left is what actually changed.
Every number below is a ΔE: one figure for how far two colours sit apart. Around 1 is about the smallest difference a person can reliably pick out, so anything in double figures is a change nobody would argue about.
The same board, measured two ways
Dirt pickup on a transparent wood stain — a red iron oxide slurry on the lower half of each board, scanned before and after. A delta needs the same place measured twice. An aperture never lands back in exactly the same spot, and the grain it lands on moves the answer.
Spectrophotometer — one aperture
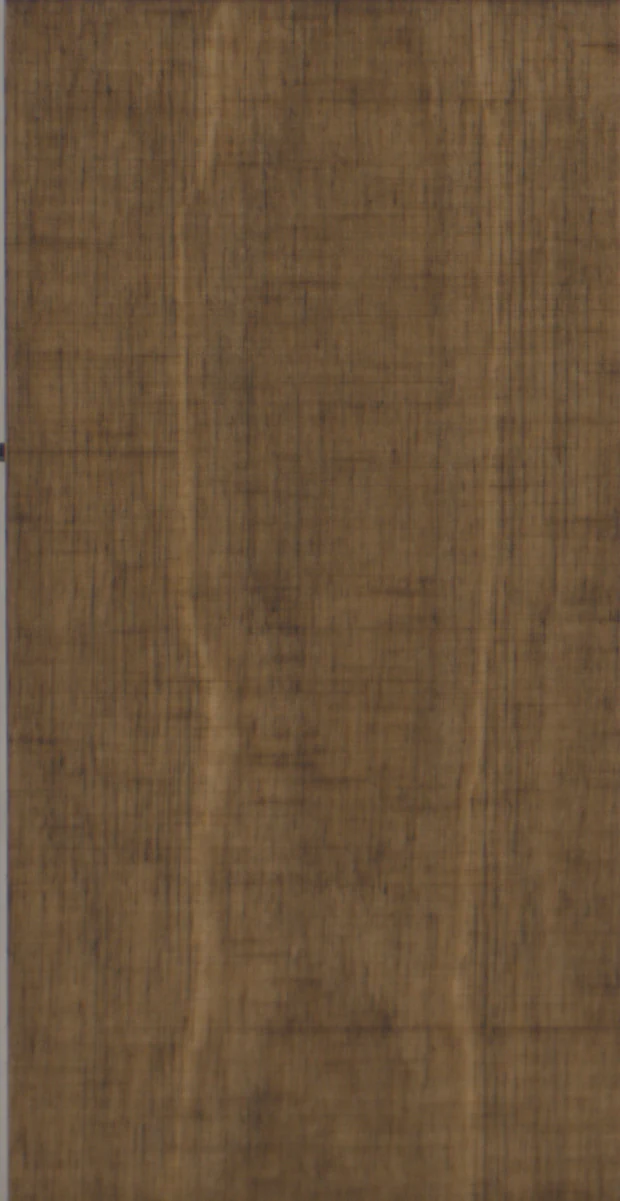
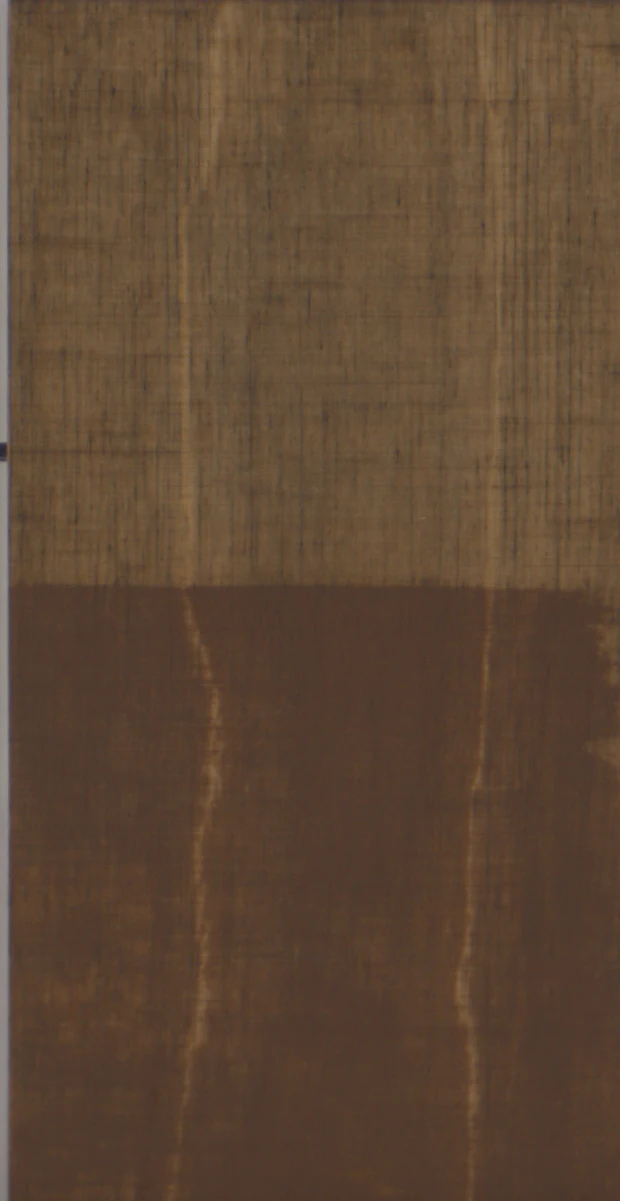
On Pre the aperture stays where it was first registered. On Post, only where it lands changes.
Panel imaging — every pixel, twice
- Two scans
- Aligned
- Stacked
- Overlaid
- Differenced
the area being differenced
The difference is taken between the two panels across everything inside the box — the soiled half, every pixel of it, on both scans.
Read off the two scans shown, not modelled. Put the aperture back exactly where it started and it returns 10.30. The whole soiled half returns 10.31, which is the same answer. Move that aperture one centimetre and it returns 9.03. Nothing about the board changed between those three readings. Only where the aperture landed.
And again, after 1500 hours of QUV
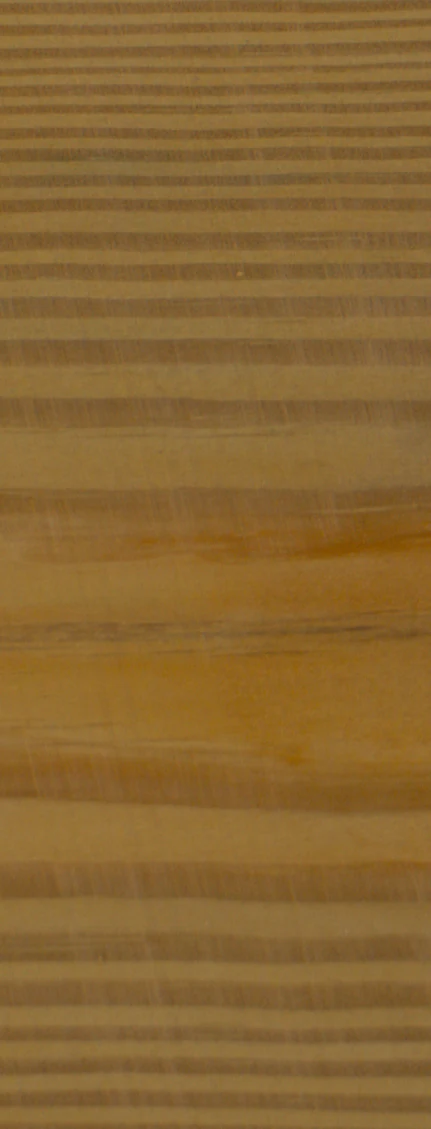
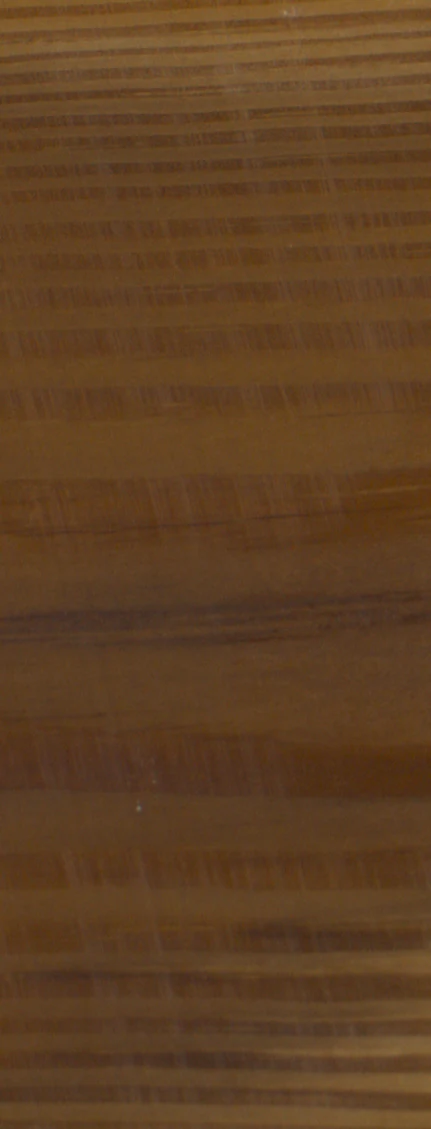
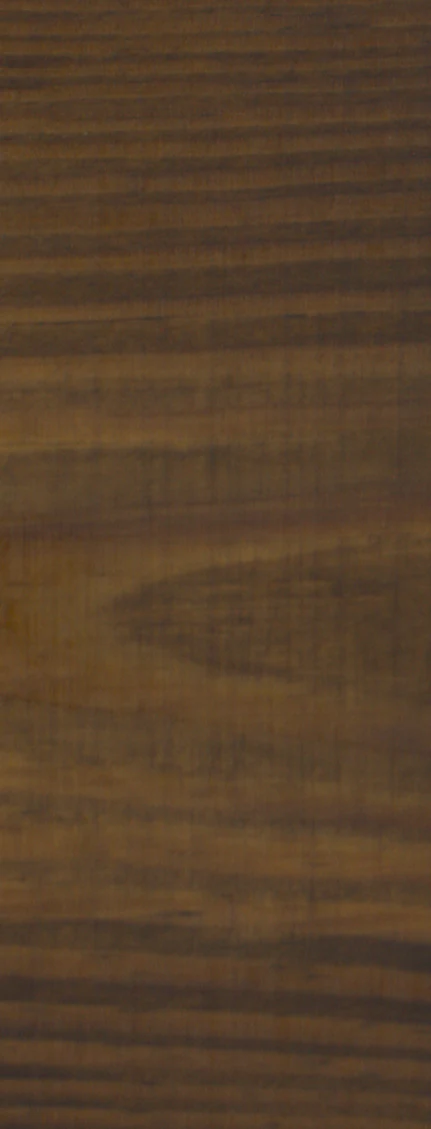
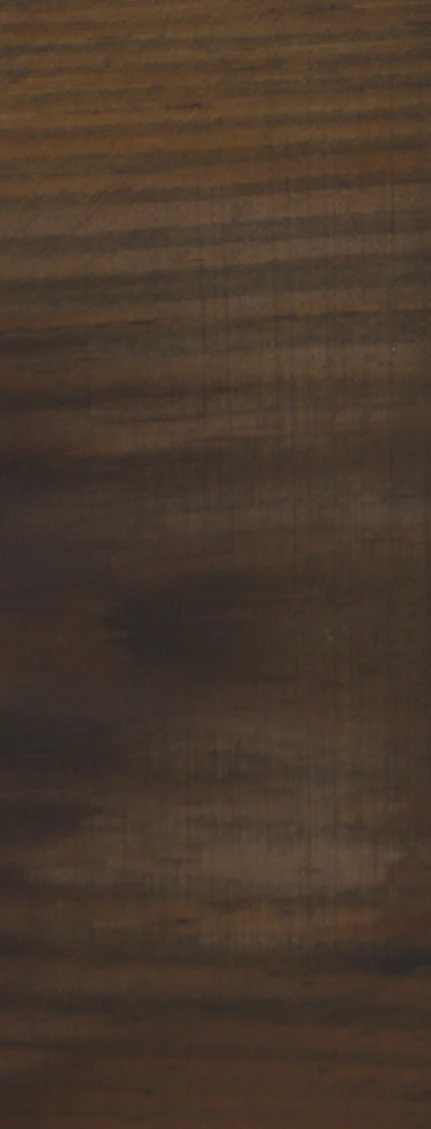
A different study, the same problem. Stained boards went into accelerated weathering and came out 1500 hours later; the stain has faded, the grain has not moved. The delta is only meaningful if the same wood is measured both times.
Spectrophotometer — one aperture
The aperture lands in the same place on both scans, which is the best case the instrument can have. What changes from reading to reading is which place was picked.
Panel imaging — every pixel, twice
- Two scans
- Aligned
- Stacked
- Overlaid
- Differenced
0.96
Lowest of the aperture readings on this board
24.03
Highest, about two centimetres away
8.13
The whole face, every pixel on both scans
Four placements on the same board, on the same day. Each is a correct reading of the spot it landed on, and they disagree by 23 ΔE. The board did not change between them; only the spot did. Read the whole face instead and it returns 8.13 wherever you start.
04 — The algorithm
The hardware is half of it
Anyone can point a camera at a panel. What turns an image into a rating is the algorithm reading it — and ours has been developed and corrected against the thousands of panels that move through this lab every year.
That volume is the part that cannot be bought. Every batch that comes through is another check on whether the numbers agree with what an experienced rater sees, across substrates, coatings and exposure conditions. It is why the output holds up as quality control rather than as a novelty.
05 — What it makes measurable
Subjective ratings become numbers
Some of the tests we run this way. Each one used to end with a person deciding what they saw. Each one now ends with a number that anybody can check.
Washability & scrub
Someone compares the scrubbed panel against a set of reference panels and picks the closest match.
How much the scrubbed area actually changed, measured across all of it, at a stated number of cycles.
Dirt pickup resistance
Panels held side by side and ranked by eye.
The change measured at every point, so a panel that soiled unevenly does not read as an average.
Hiding & opacity on an applied film
Spot readings averaged, whether or not the film was uniform enough for a few spots to represent it.
Contrast ratio from the whole area once the film has been rolled, brushed or sprayed and is no longer uniform.
Burnish
A judgement call about how much sheen the rubbed area picked up.
The rubbed area measured against the surface beside it, which was never touched.
Colour on grained and patterned surfaces
Close to unmeasurable with a small aperture, because the surface itself moves the reading.
Read across the real surface, grain, knots and all, before the test and again after.
06 — Case study
The cleaner changes the answer
Washability is meant to be a controlled test. We ran a set of cleaners against a standard non-abrasive cleaner, holding everything else constant, and the cleaner alone moved the result. If something that incidental can shift the outcome, the measurement has to be good enough to see it.
- Substrate
- Flat interior architectural paint
- Stain dwell
- 24 hours
- Wash cycles
- 50
- Variable
- Cleaner only
Unstained
The panel as drawn down.
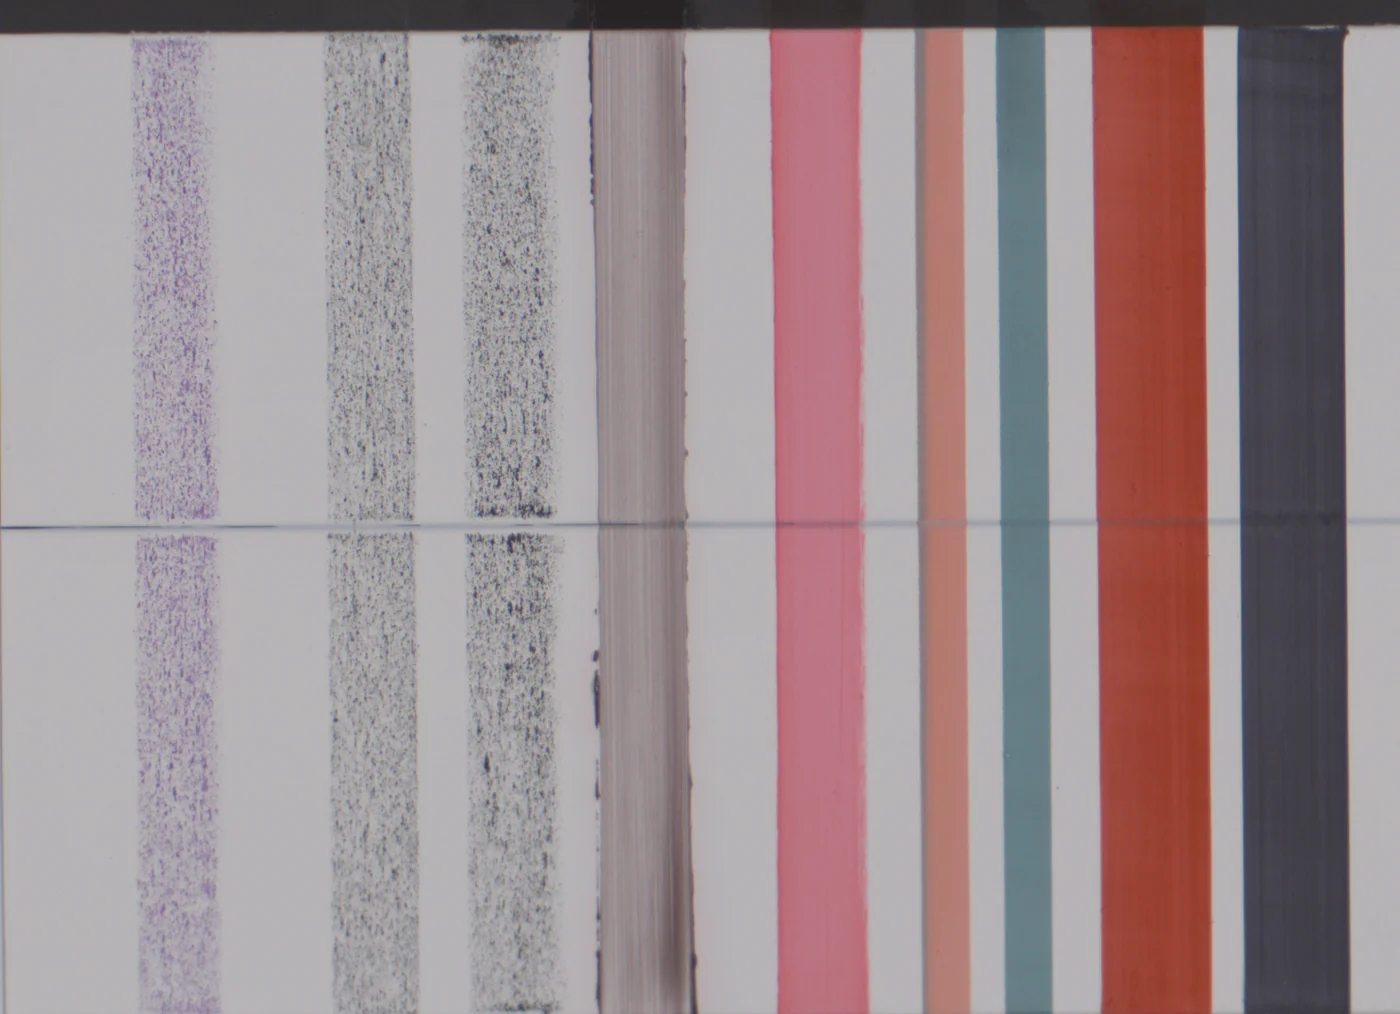
Stained
Stains applied, left to dwell 24 hours.
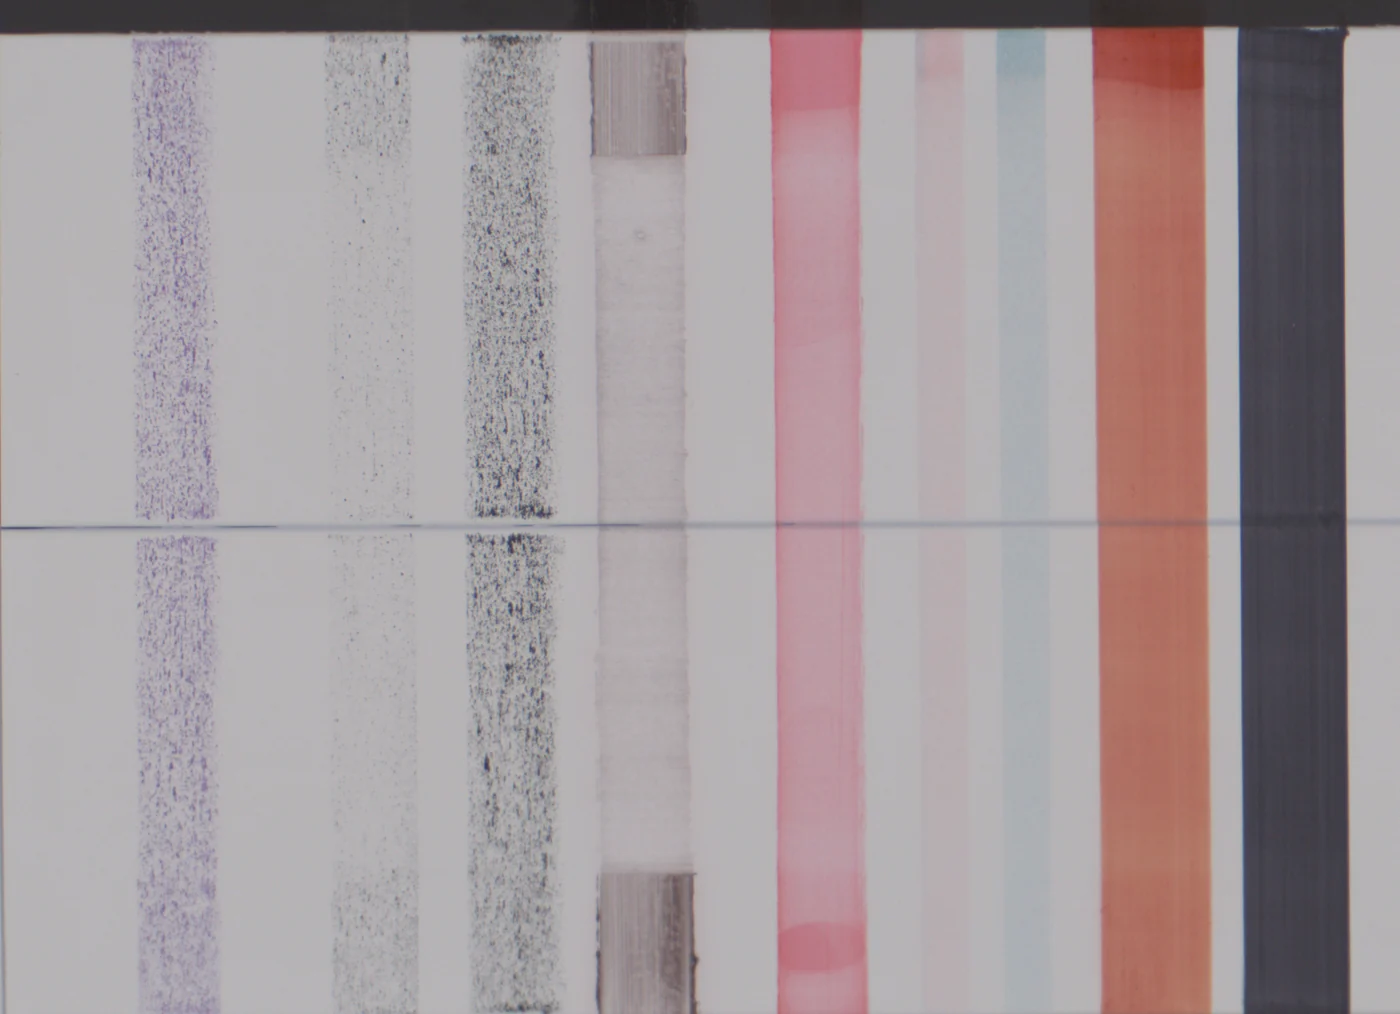
Washed
After 50 cycles with a standard non-abrasive cleaner.
The cleaners are reported anonymously; only the standard one is identified as such.
From the deck to one stain
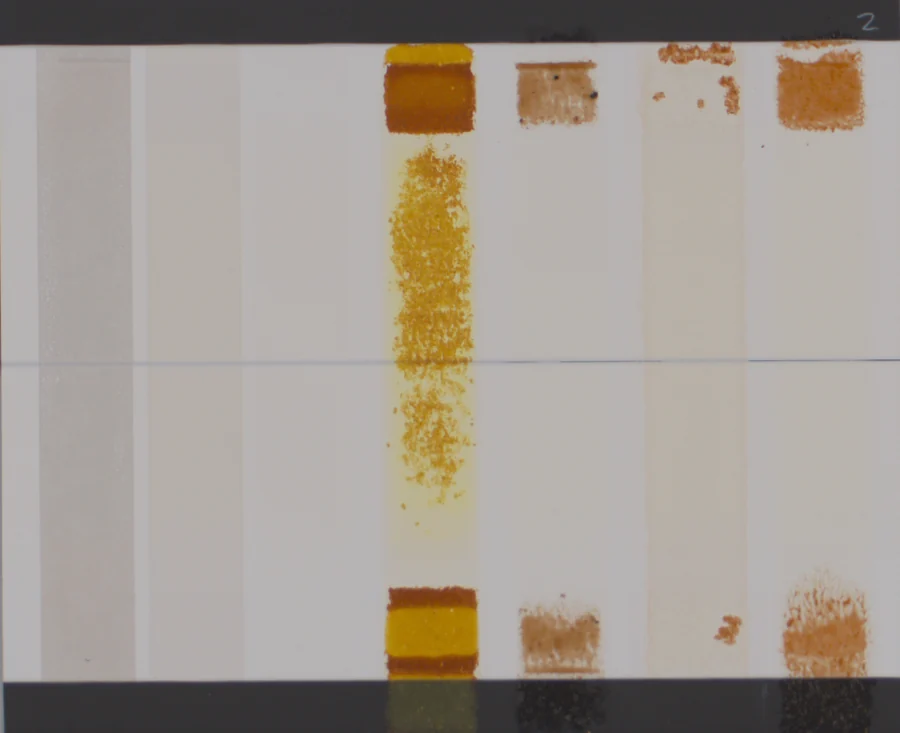
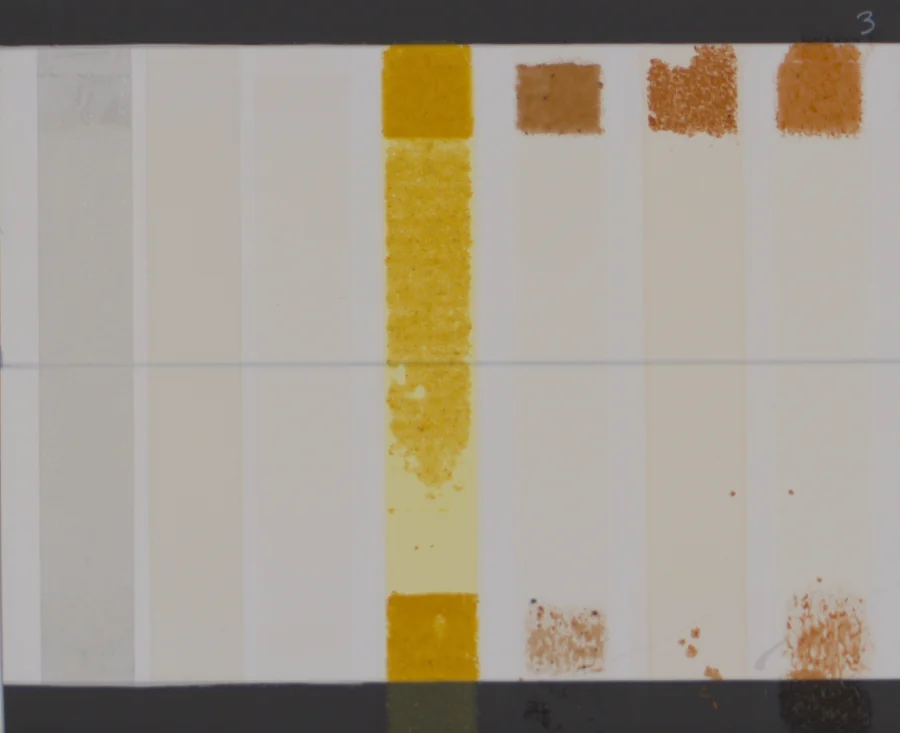
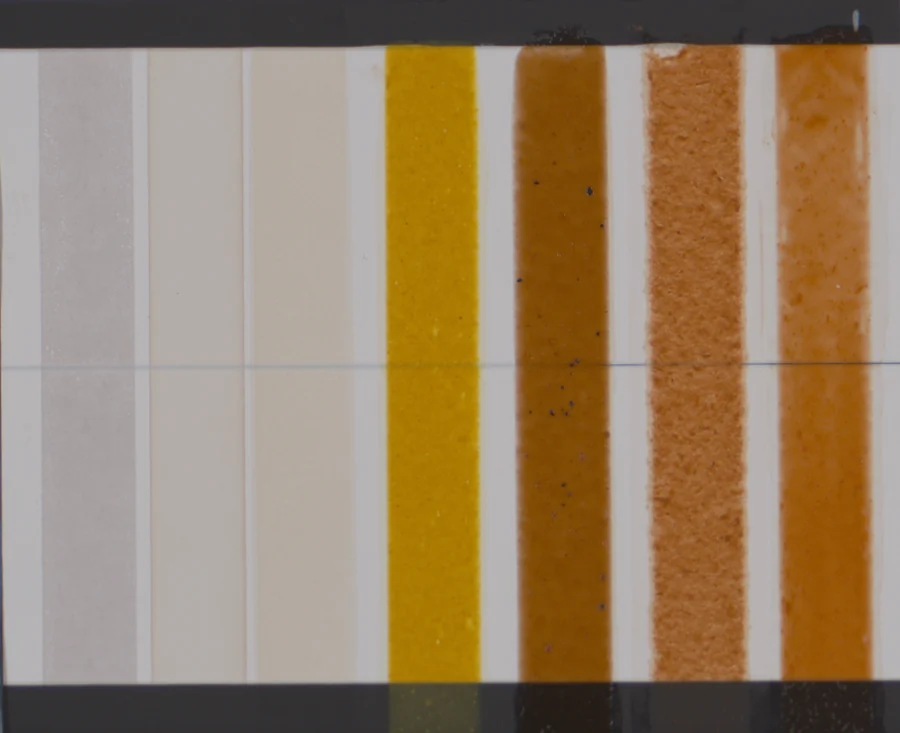
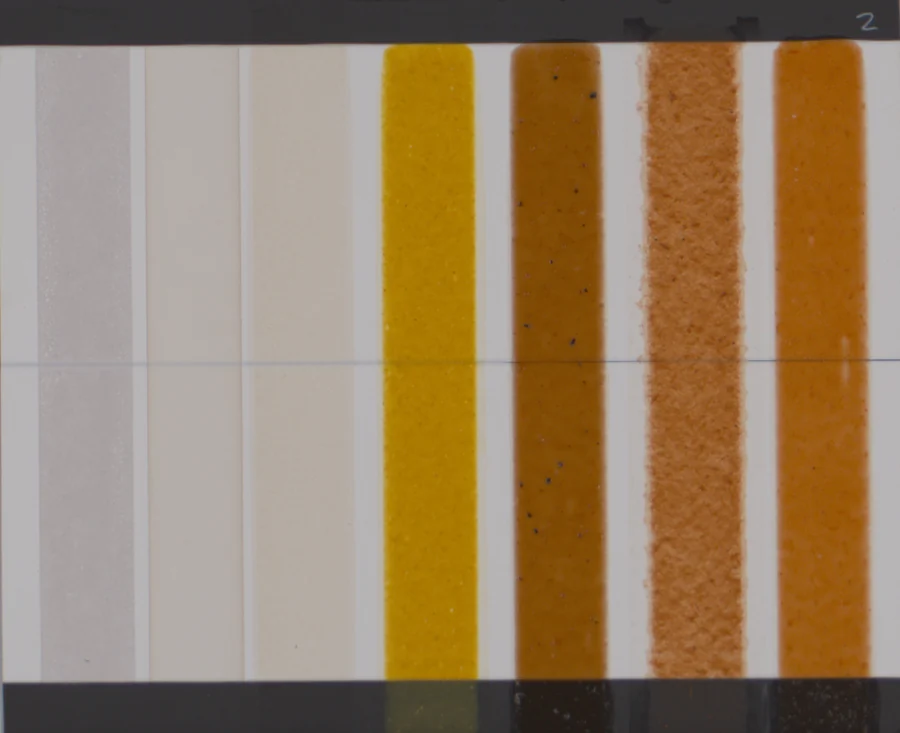
Nothing on this page is a photograph we liked the look of. Every number in this study is cut out of a scan in three steps, at coordinates that do not move: the deck as it comes off the instrument, the board, and then the one stain being read. Because the coordinates are fixed, the rectangle measured after washing is the same piece of board that was measured before it.
Choose a stain
One pass, after 50 cycles · 9880 × 1947 px

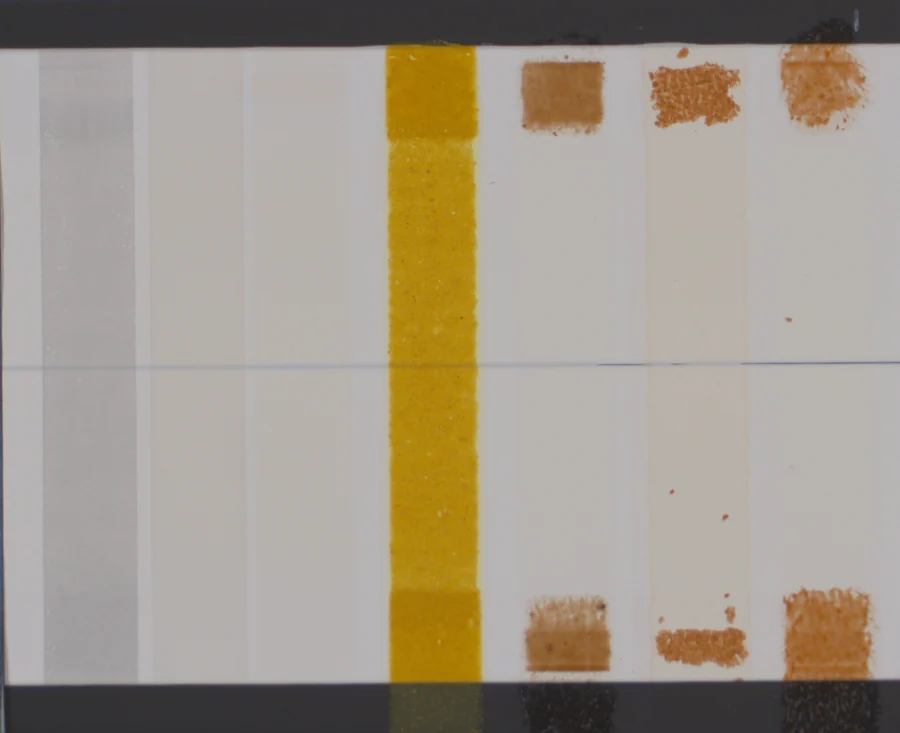
Board 01 · Standard cleaner
Board 02 · Cleaner G
Board 03 · Cleaner A
Mustard 91.9 → 91.4
Mustard 91.5 → 29.7
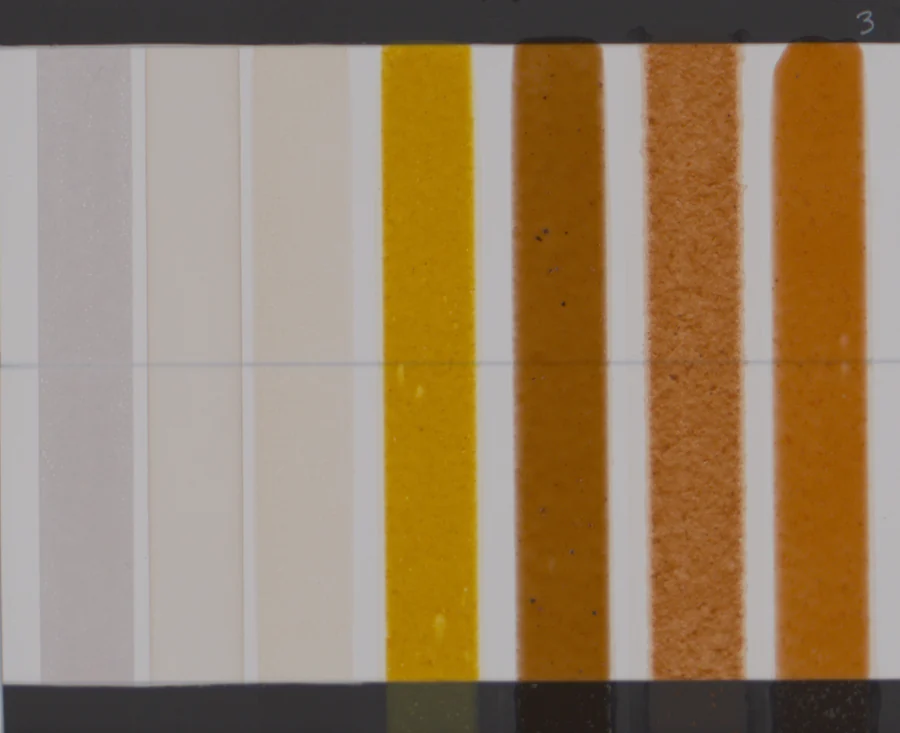
Mustard 92.1 → 44.1
Run the cursor along the stripes on any board, or use the buttons, and every board answers at once. Each board carries two trials, one above the dashed line and one below; in this example we only read trial 2. Same paint, same dwell, same 50 cycles — the cleaner is the only thing that differed between these columns.
Every panel from this study is readable in M-VIEW, imaged before staining, after staining and after washing, with the ΔE for each.
Open the study in M-VIEW
07 — Case study
The roller cover is a variable
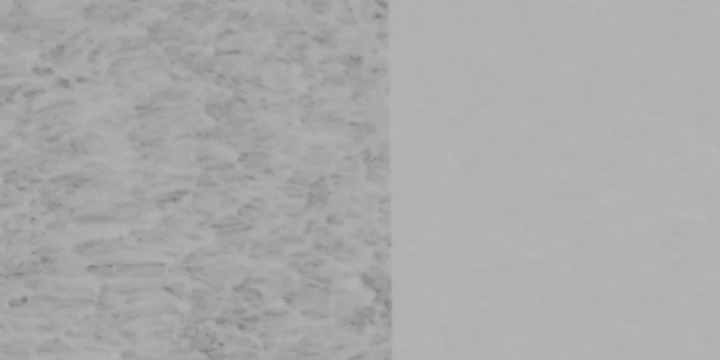
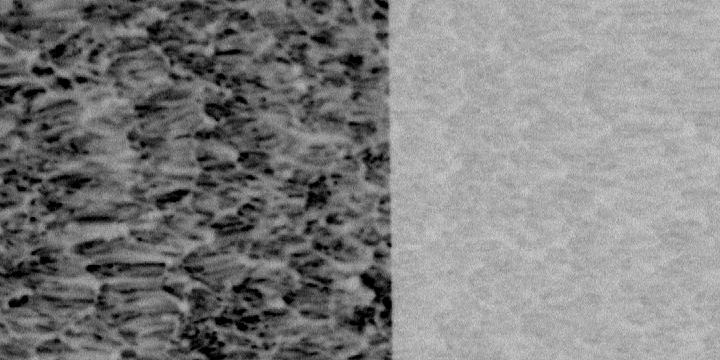
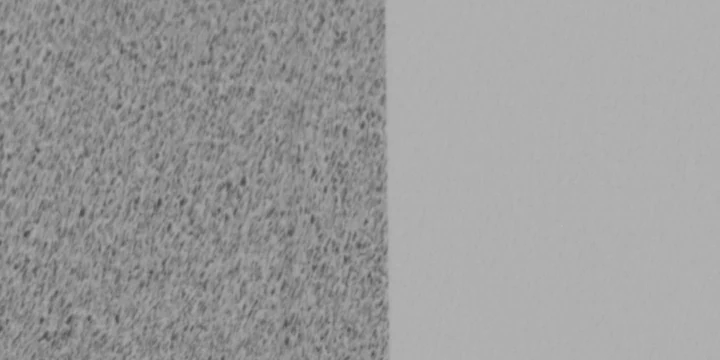
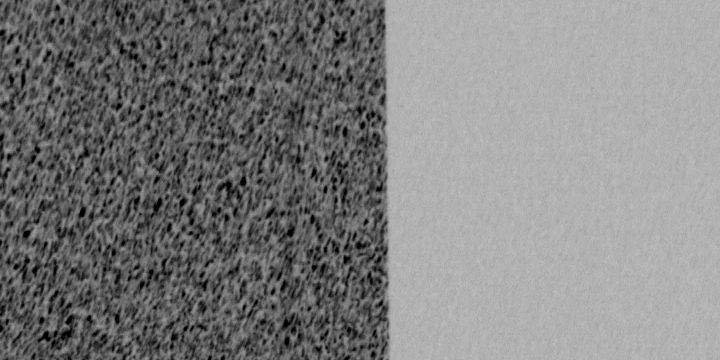
An example. A set of roller covers, the same paint, and each cover broken in the same way, rolled out on charts printed with black and white squares and scanned whole. The job was to read every square on every chart — slow work one spot at a time, and free from a scan.
How well a paint hides shows up over the black squares. Wherever the roller left the film slightly thin, a little of the black underneath comes through, so the pattern the cover left behind is recorded in the scan even though it is too faint to see. Brightening the scan’s own range brings it back out. We call that X-ray. Nothing is added: it is the same picture, with the narrow band of shades the pattern occupies spread across the whole range.
Contrast ratio is how well the paint hid the black underneath. Higher is better; 1.00 would be perfect.
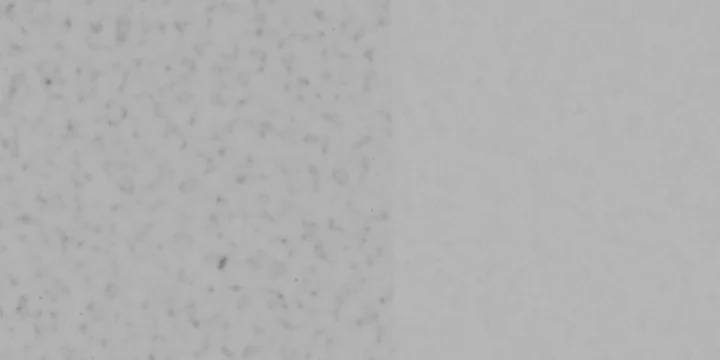
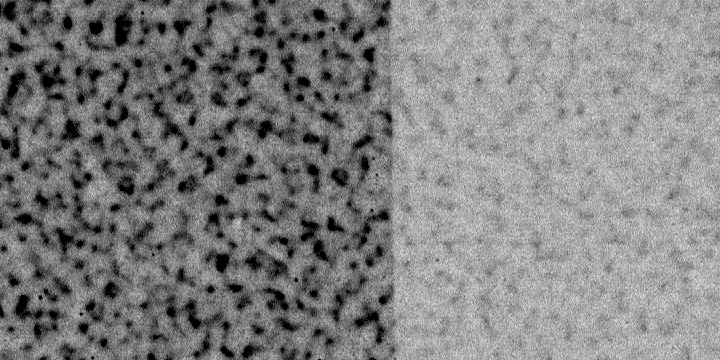
Cover A
0.942
Contrast ratio
Cover B
0.858
Contrast ratio
Cover C
0.655
Contrast ratio
Every cover in the set
Same paint in every one of these. The covers land anywhere from 0.640 to 0.951, which is the difference between a paint that hides and one that does not, decided by the roller rather than the formulation. The three shown sit near the top of that range, in the middle, and near the bottom.
08 — Where it is going
Beyond architectural coatings
Everything on this page is an example of what we currently use the system for, not a list of what it can do. The method is not specific to paint. Anywhere performance is judged by looking at a surface, the same instrument and the same reading apply.
The work we are most interested in is the work outside our own industry. If a test in your field still comes down to someone deciding what a surface looks like, we would like to hear about it, whether or not it has anything to do with coatings.
- CASE
- Coatings, adhesives, sealants and elastomers — the chemistries already moving through this lab, and where most of our work sits today.
- HI&I
- Household, industrial and institutional cleaning products, judged on what they lift off a surface and what they leave behind.
- Textiles
- Coated fabrics and technical textiles, where appearance change across a woven surface is exactly the sort of non-uniform problem an aperture handles badly.
- Building materials
- Anything specified on how it looks and how that holds up — cladding, decking, roofing, concrete, laminates and the finishes on them.
- Personal care
- Colour, coverage and evenness in cosmetics and skincare, judged today much the way coatings were: by eye, against a reference, by a trained person.
09 — Reading the data
M-VIEW
The system produces the data. M-VIEW is where you read it — our web platform for the images, the numbers behind them and the panel ratings, so your whole team works from one source rather than a stack of PDFs.
View a sample project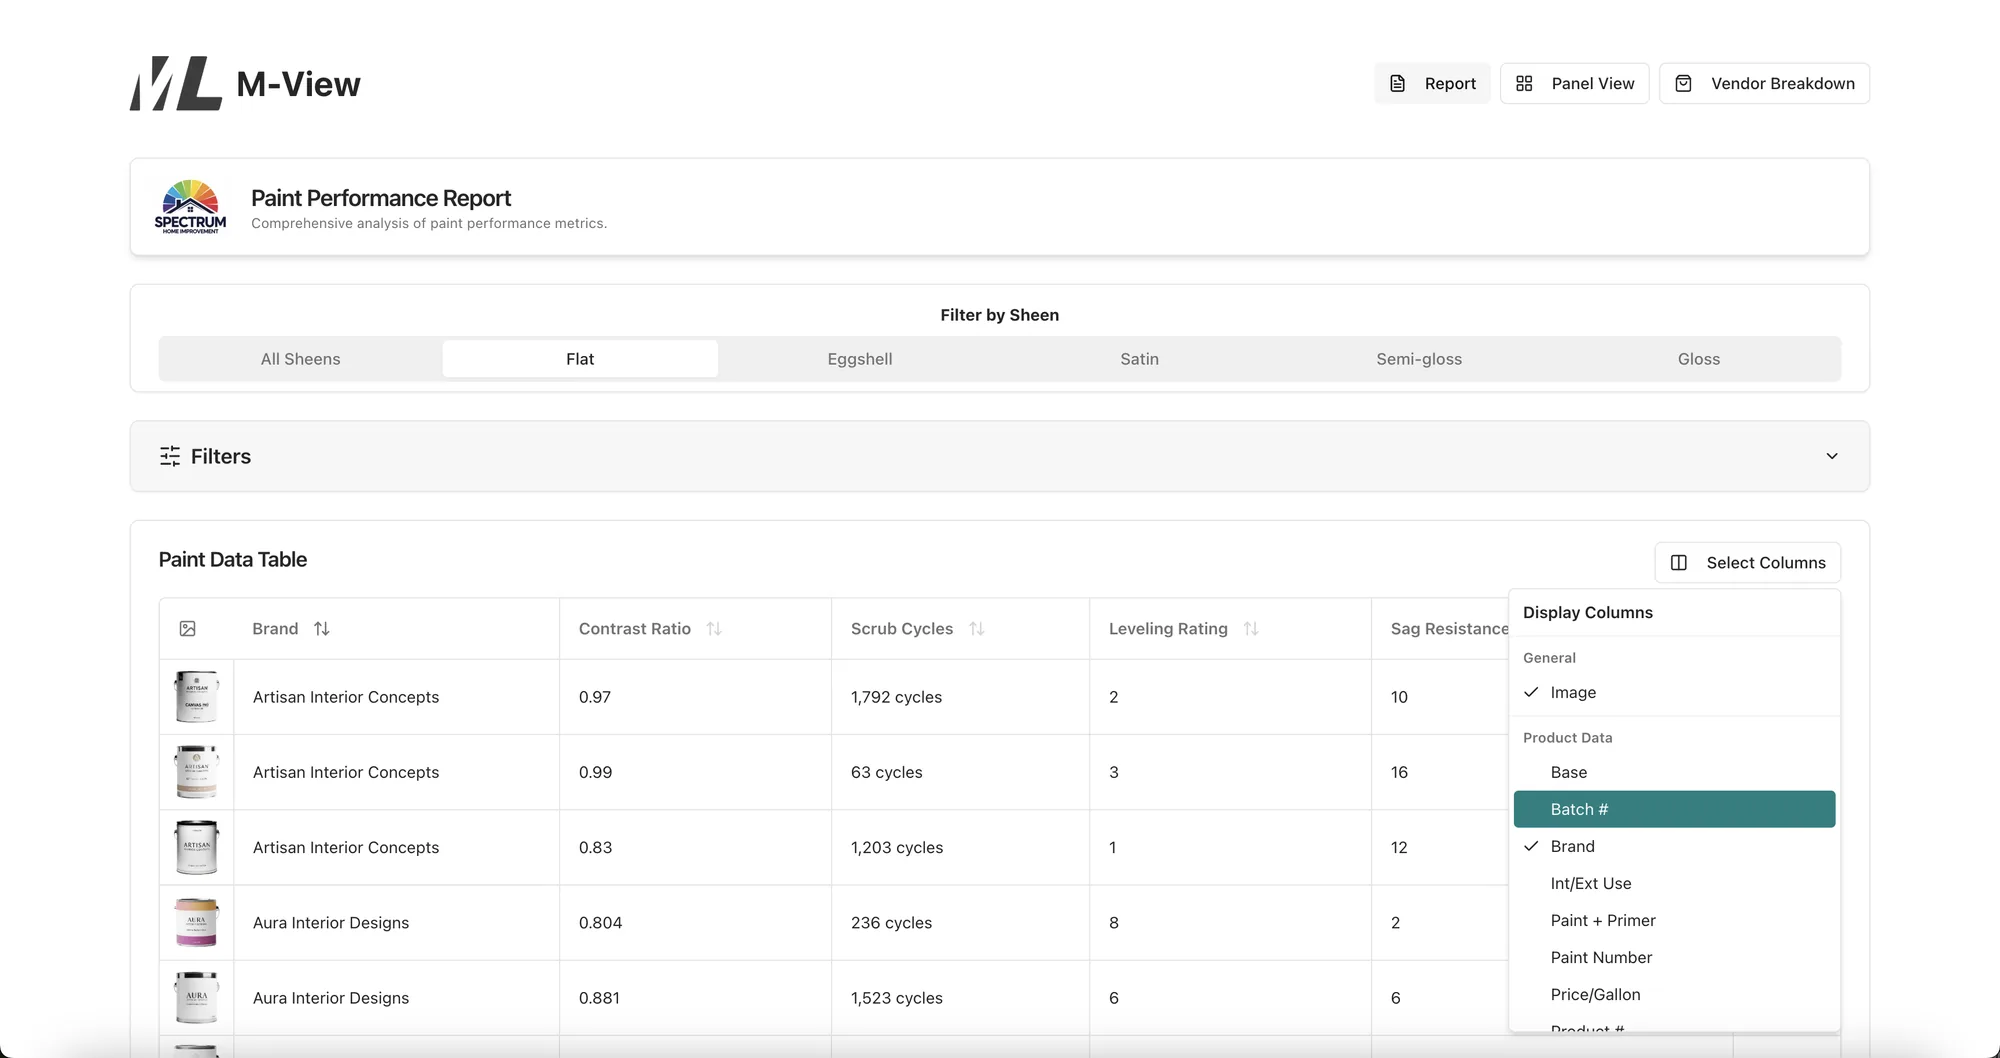
Have a test that has always been a judgement call?
Tell us what you are trying to resolve and we will tell you whether the scanner can put a number on it.
Talk to the lab